How to analyze your marketing reports - our proven method
We have made more than 80 marketing templates and helped dozens of marketing teams to use their data to move faster, we tell you how we analyze it, so you can do it too.
Instead of just guessing or trying to impress others the best marketing teams take valuable insights from both successes and 'lessons learned' to enhance their strategies.
But you might be wondering, how can you achieve this?
You need three things: data, methodology, and a curiosity mindset.
Reports often fall short on the actionability scale due to a combination of the following issues:
Lack of clear goals ⚠️
Absence of meaningful comparisons ⚠️
Insufficient business context
Overwhelming clutter of unnecessary data ⚠️
That's where our methodology comes in.
We've been applying it, and it could be a game-changer for you.
Start with Specifics:
Begin with a clear goal.
Identify the desired outcomes you want to optimize for.
Pinpoint the metrics that directly influence those outcomes.
To take action effectively, you need to focus on the leading indicators—those that have a direct impact on your results.
For instance, if your goal is to generate more qualified leads, break it down by analyzing which channels or content types are driving leads effectively.
Let's illustrate this with Porter Metrics as an example.
Goal: Achieve a 10% increase in Monthly Recurring Revenue (MRR)
Desired Business Outcomes: New customers.
Key Leading Indicators:Number of trial sign-ups, report setups, and sales calls.
Engagement/Interest Metrics:Downloads of templates and report loads during trial periods.
Detailed Breakdown By:Product, channel, and content.
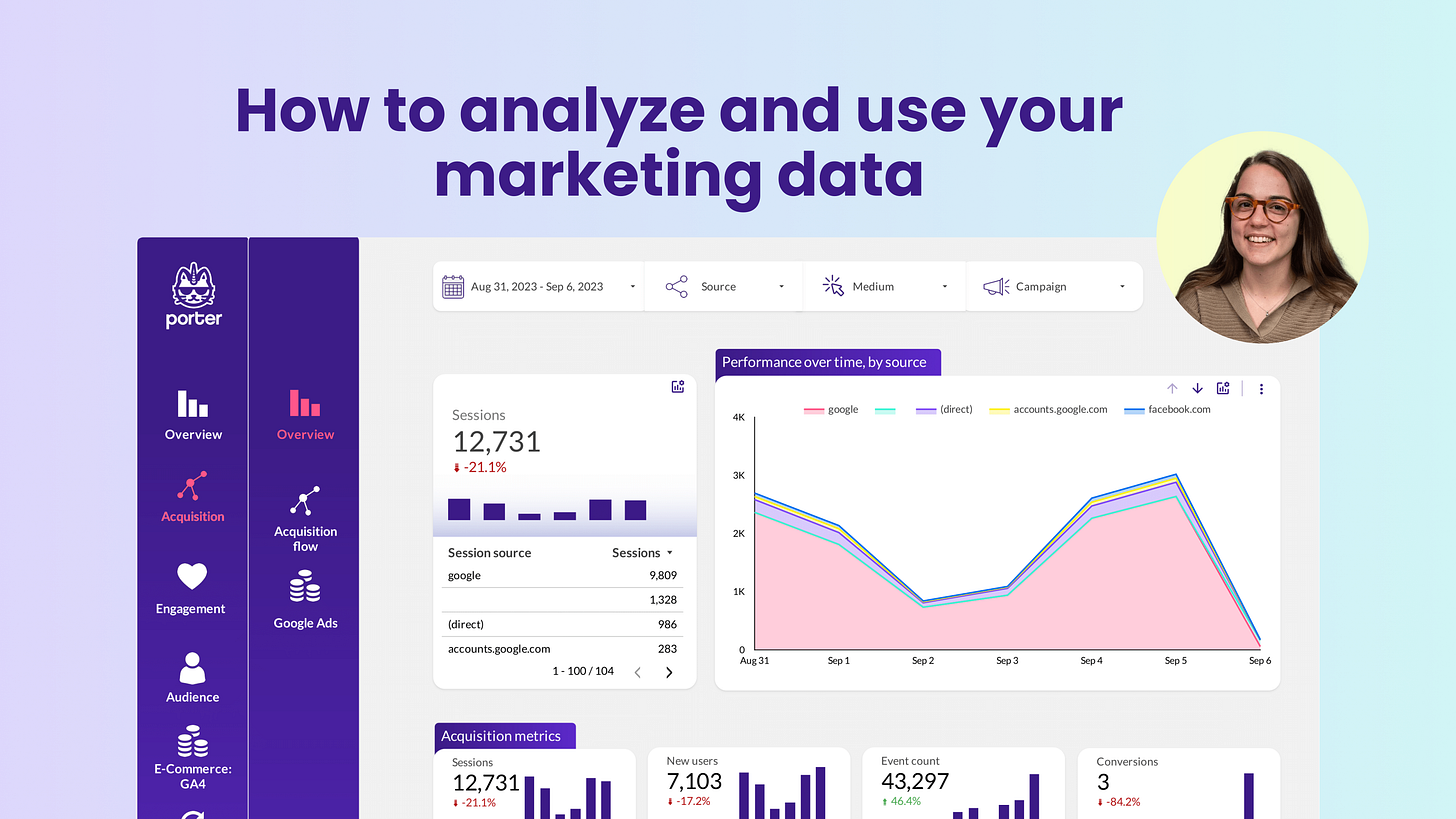
You can build and automate this process using Looker Studio:
And then you can break down that data to understand where the results are coming from.
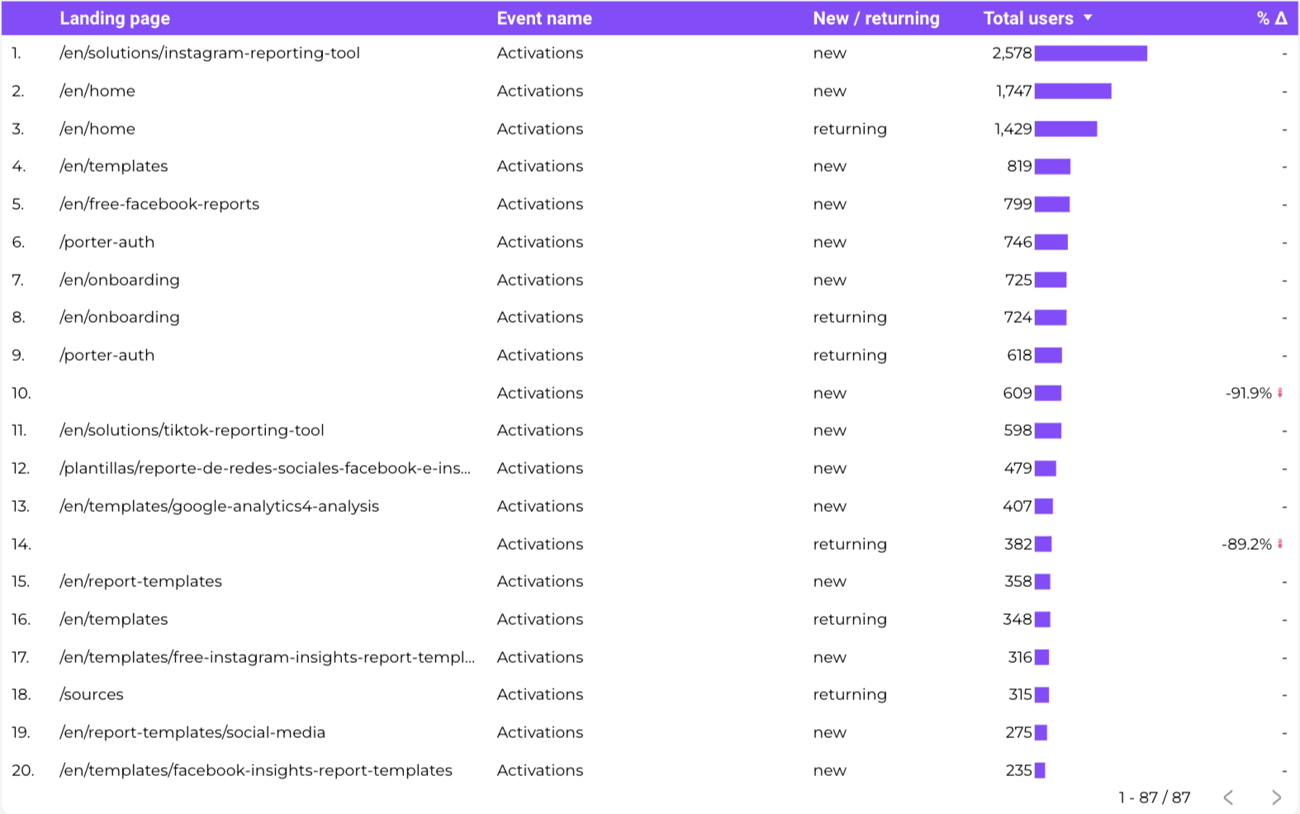
For instance, to understand where the 'Trials' are coming from, I combined the landing page name with the event 'Activations' and segmented the data by new and returning users.
Now, I have an idea about what drives conversions for 'new' and 'returning' users.
I can formulate hypotheses and track the changes in results on these pages.
And you can do all of this with the Google Suite (Google Tag Manager, GA4, Looker Studio) you can create a really good system to track your marketing KPI’s.
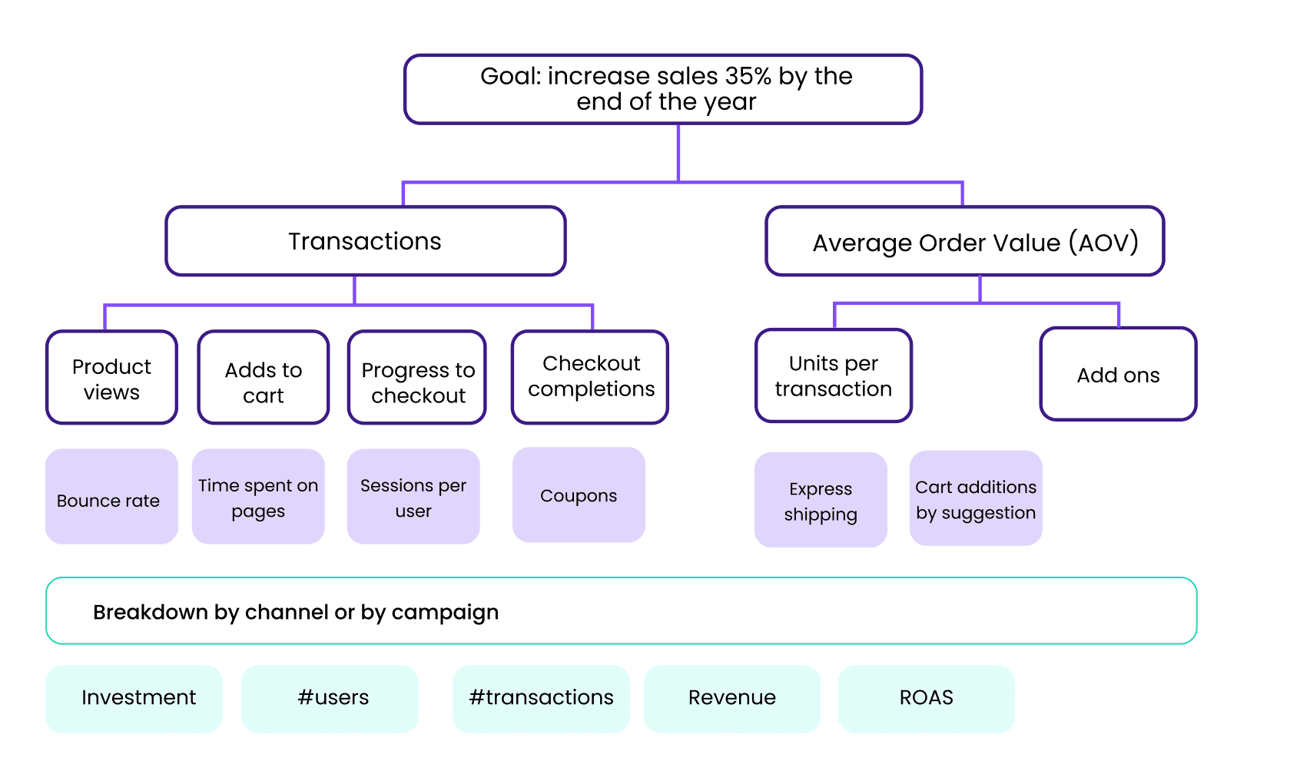
Now, let’s see a visual example of an ecommerce brand:
And depending on the platforms you use and your business model, you can connect all the platforms you use to your reports. For instance:
E-commerce:
Paid media: Facebook Ads, TikTok Ads, Twitter Ads, Google Ads.
Social Media: Instagram, Facebook, TikTok.
Stores: WooCommerce, Shopify, and GA4.
CRM: Klaviyo.
Lead Generation (B2B):
Paid media: Google Ads, LinkedIn Ads.
Social Media: LinkedIn Pages.
CRM: Hubspot, Active Campaign.
Hope this detailed process help you start with your own data.
If you want to connect your data to Looker Studio, you can start here
Do you have questions? we are happy to help


